Some data on those most affected by COVID19 in Peru: The poor (Part I)
Published:
Since Monday, March 16, the Peruvian Government ordered compulsory social immobility as a measure aimed at halting the advance of COVID19 expressed in the largest number of positive cases in tests administered by the Ministry of Health. As a result, most of the country’s economic activities have been disrupted, threatening the payment chain and the population’s living conditions. Thus, the Government has announced the implementation of a grant per family that provides income (S/380 = USD 110) to the poorest people and, also more recently, to people who work independently and have informal jobs. In this first article, therefore, I intend to provide more information about the type of people that this type of subsidy should target to reduce the effect of this shock on their living conditions, particularly the poor. In a future document I plan to focus on the analysis of informality in the country.
We have to start by recognizing that Peru is part of one of the most unequal regions in the world, Latin America, in terms of income distribution (Lustig, 2015). Likewise, the historical series of income at the national level allow us to recognize that in recent years the labor income of both public and private sector workers has grown at a growth rate much lower than that of per capita income (“the cake it has not been distributed equally to everyone”), which would suggest that the fraction corresponding to the benefits in national income should have risen, increasing social inequality in the country (Mendoza, Flor, & Leyva, 2015).
Next, with information from the National Household Survey of Peru (ENAHO), I will set out to provide some data on the levels of monetary poverty in the country in order to recognize the most vulnerable segments to whom the greatest aid should be allocated 1. It is of utmost importance to understand that the lack of economic activities in extreme contexts such as the one we live in would lead to the absence of income (assuming that no state grant would occur) in the poorest, which could further exacerbate inequalities in the country. Recall that Figueroa (2015) points out that in capitalist societies there is a limited social tolerance of inequality that, if exceeded, would lead to a state of social disorder (the rules of the institutional context are broken).
For 2018, the most recent ENAHO year, the incidence of monetary poverty2 in the country was 20.5%, which would mean that nearly 6,6 million people distributed in about 1,5 million households live in poverty. That is, they have a per capita expenditure below the poverty line (monetary value with which the monthly per capita expenditure of a household is compared to determine if the household is in poverty)3.
If we could identify the average Peruvian in poverty, this would be a 28-year-old woman with an incomplete elementary school, underemployed 4, dedicated to agriculture, who speaks Spanish, whit an informal job and who lives in Lima.
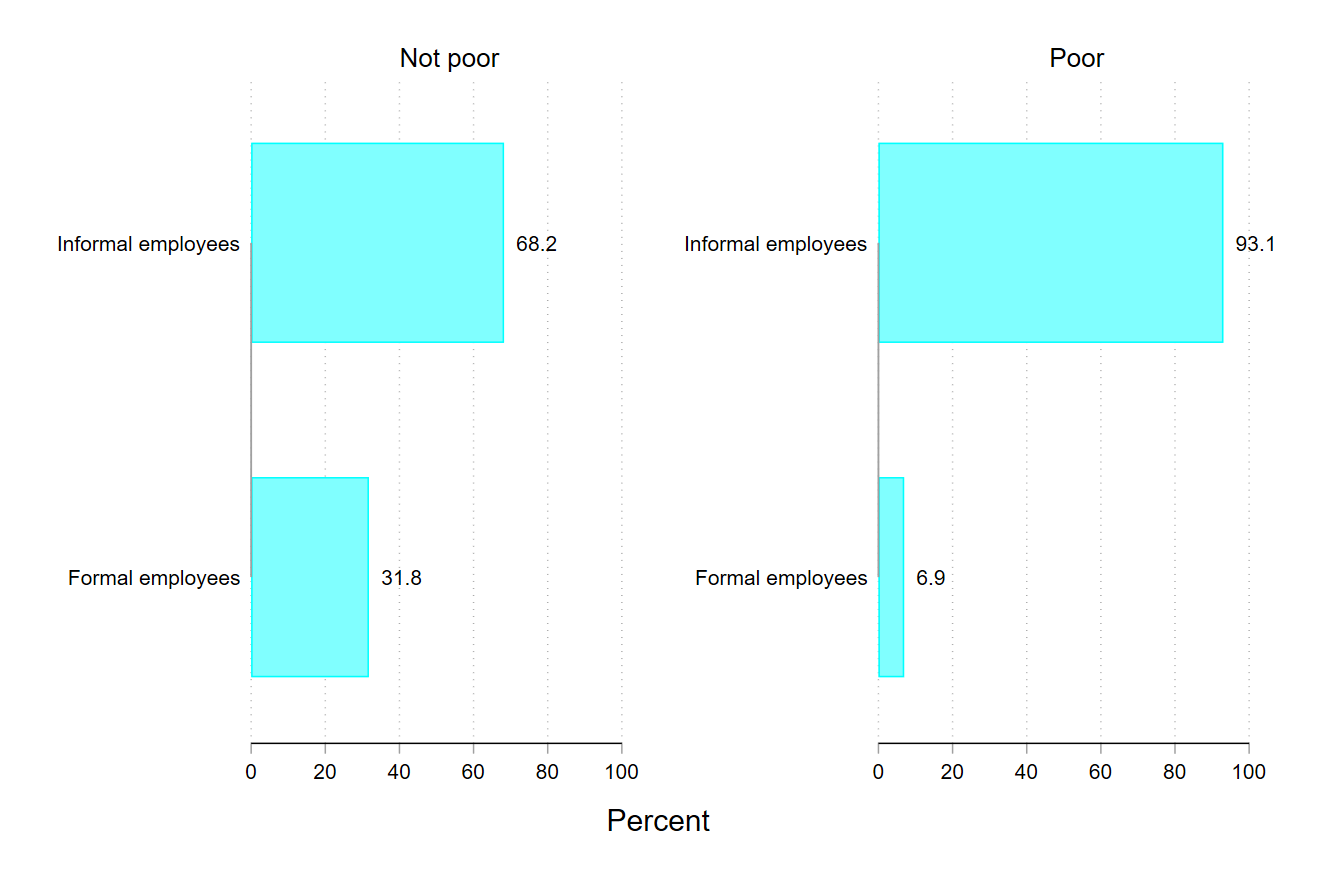
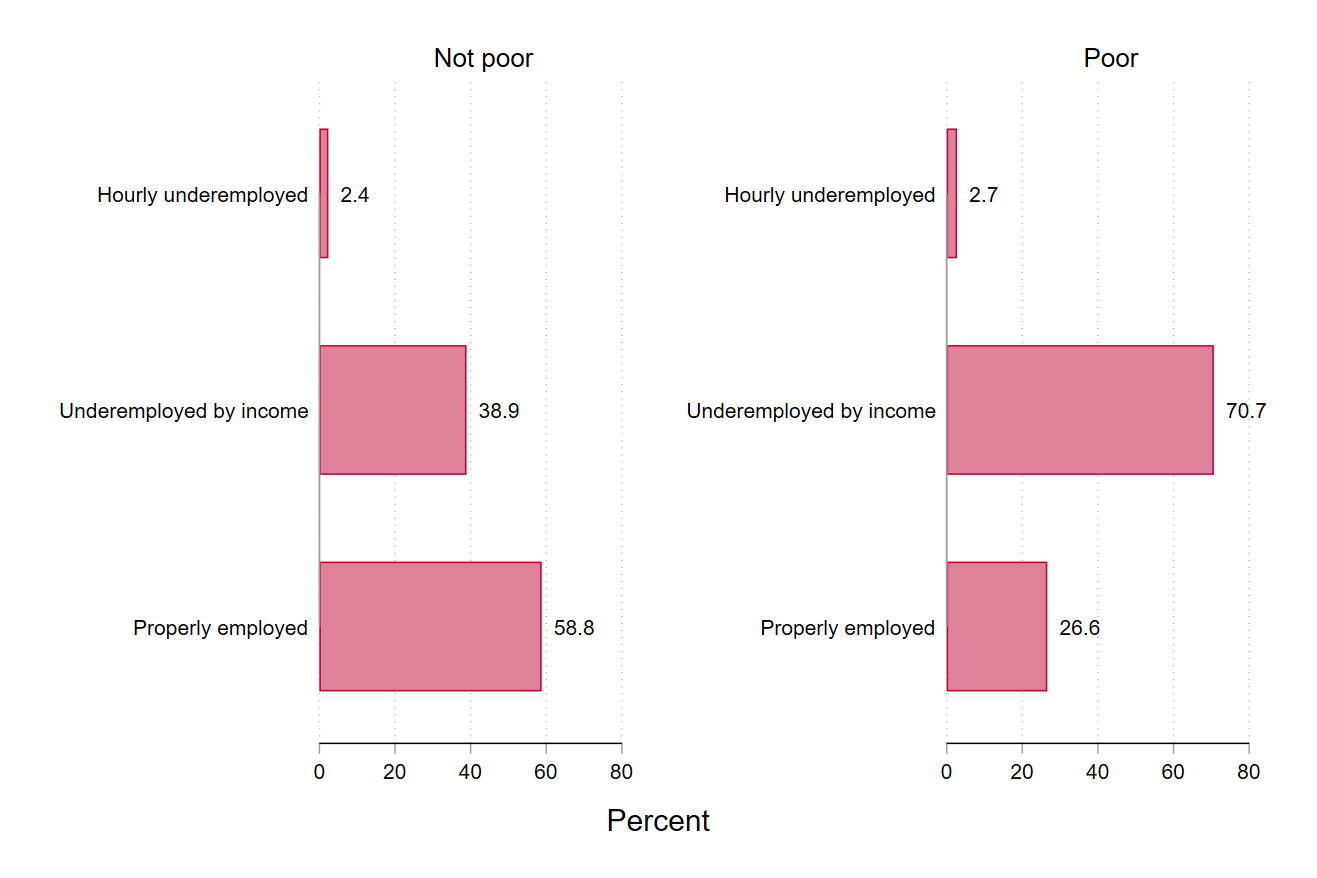
In Peru, the majority of the poor people are women (51.3%) and among those who are under 18 years of age and over or equal to 65 years of age, they represent nearly half of the country’s poor (49.1%). Likewise, about half of the country’s poor who are no longer studying only reached the initial educational level or less (36.6%). In addition, around 66.2% of the working-age poor (from 14 years of age and over) are employed but 93.1% of them do it in informal jobs (in the case of the non-poor this figure is 68.2%) and 70.1% are underemployed (in the case of the non-poor this figure is 41.2%). 45.2% of the country’s poor work in their jobs as independent workers and 51.1% of their jobs are in agriculture (in the case of the non-poor, employment in this sector is only 17.7%).
Figure 1. Peru: Levels of Informality in Employment of the Monetary Poor, 2018 
Source: ENAHO - INEI. Own elaboration.
Figure 2. Peru: Adequate employment and underemployment rate (by hours and income) of the monetary poor, 2018 
Source: ENAHO - INEI. Own elaboration.
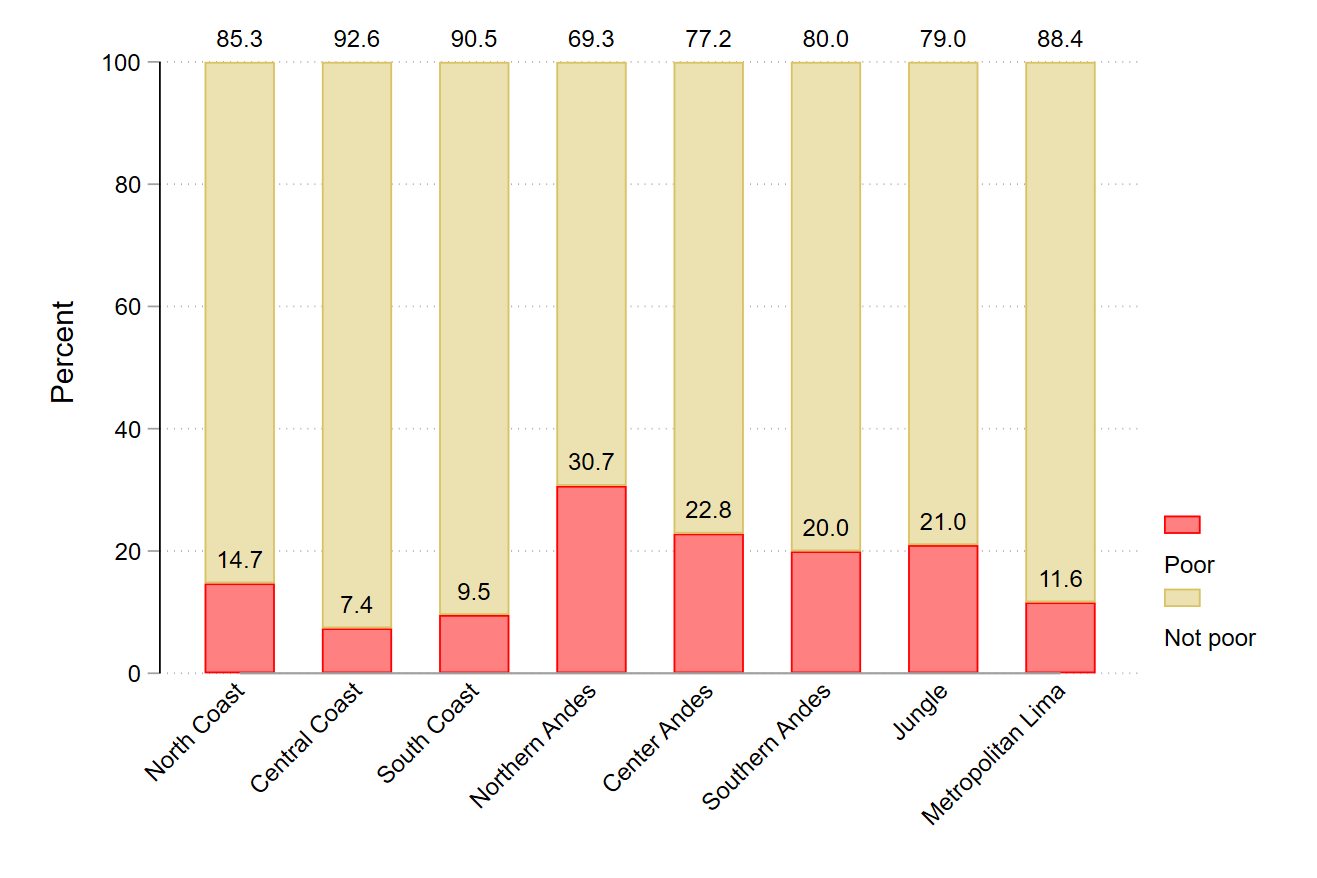
Territorially, the poor (extreme and non-extreme) are found in a greater proportion in the urban area (55%) than in the rural area (45%). If we only consider the extremely poor, the relationship is reversed with a higher proportion of extreme poor in rural areas (78%) in relation to urban areas (22%). Now, once again considering the aggregate distribution of poverty, a higher incidence is observed in the geographical domains of the Northern Andes (30.7%), the Center Andes (22.8%) and the Jungle (21%). In contrast, the lowest incidence of poverty is found in the Central Coast (7.4%), the Southern Coast (9.5%) and Metropolitan Lima (11.6%).
Figure 3. Peru: Poverty rate by geographic domains, 2018 
Source: ENAHO - INEI. Own elaboration.
Poor households have a very different demographic composition than non-poor households. On average, poor households have a larger number of members, have a higher proportion of dependent people and have a higher incidence of disabled people. Also, on average these households have younger people as head of household compared to non-poor households.
Regularly, poor households have four members while non-poor have three. Also, poor households have a higher rate of economic dependency expressed in a greater number of minors (under 18 years), but not necessarily in a greater presence of older adults (65 years and over): 75.3% of households living in poverty there is at least one person under the age of 18 (52.5% in non-poor households) and 28.7% of poor households include at least one older adult (30.3% in non-poor households). Likewise, in poor households there is a greater presence of people with disabilities (18.3%) in relation to non-poor households (13.4%). Finally, another characteristic of poor households is the younger age of the heads of households: 50 years in poor households and 53 years in non-poor households.
As we have seen, there are several dimensions associated with poverty that give individuals greater vulnerability to exogenous shocks that deprive them of the normal development of their economic activities. Recognizing these dimensions and properly identifying the poor, in order to provide them with adequate support and thus be able to better face the crisis, is vital to ensure the sustainability of growth and the non-worsening of inequality levels in the country. The crisis will pass and for this, we need the poor not to become poorer not only because of an ethical issue (which should be the most important) but also because the recovery will need strong support from the demand side. In a future article, I will address the problem of informality in employment to complement the analysis of subsidies.
References
Figueroa, A. (2015). Growth, employment, inequality, and the environment: Unity of knowledge in economics. Springer.
INEI. (2019). Perú: Evolución de los Indicadores de Empleo e Ingreso por Departamento, 2007-2018. Lima: Instituto Nacional de Estadística e Informática.
Lustig, N. (2015). La mayor desigualdad del mundo: América Latina es una región de marcados contrastes en términos de ingreso, pero está mejorando. Finanzas y desarrollo: publicación trimestral del Fondo Monetario Internacional y del Banco Mundial, 14-16.
Mendoza, W., Flor, J. L., & Leyva, J. (2015). La distribución del ingreso en el Perú (1950-2010). En C. Contreras, J. Incio, S. López, C. Mazzeo, & W. Mendoza, La desigualdad de la distribución de ingresos en el Perú. Orígenes históricos y dinámica política y económica (págs. 225-340). Lima: Fondo Editorial de la Pontificia Universidad Católica del Perú.
Although the Emergency Decree No. 027-2020 promulgated by the Government indicates that the granting of the monetary subsidy will be made in favor of households in poverty or extreme poverty according to the Household Targeting System that are in areas with greater sanitary vulnerability defined by the Ministry of Health, here an analysis is performed with ENAHO for illustrative purposes. ↩
Unless otherwise indicated, the poor will be understood as the extreme and non-extreme poor. ↩
“The monetary measurement uses spending as an indicator of well-being, which is made up of purchases, self-consumption, self-supply, payments in kind, transfers from other households and public donations.” (INEI, 2019, p. 39). ↩
“(…) Visible underemployed are considered to be employed persons who habitually work less than a total of 35 hours per week in their main occupation and in their secondary occupation, who wish to work more hours per week and are available to do so. Likewise, a person with employment is in invisible underemployment (“Income Underemployment”), when he normally works 35 or more hours a week, but his income is less than the value of the minimum referential income. ” (INEI, 2019). ↩
